Cloud Security Monitoring: A Complete Guide for 2026
It is likely that your cloud environment expanded more quickly than your monitoring efforts did.
That is the usual trajectory. A team begins with a single cloud account, one logging service, and a handful of dashboards. Next arrive managed databases, containers, serverless functions, SaaS integrations, new identities, and transient workloads that emerge and vanish before anyone records them. Security is left with a stack of logs, a queue of alerts, and a persistent worry that the risky activity is not what is already visible. It is what no one is correlating.
That is why cloud security monitoring matters today in a way that differs from a few years ago. It is not merely about keeping audit logs or showing that you enabled something. It is about establishing a functional operating model for detection, triage, response, and compliance across systems that continually change. Teams that do this well do not gather more data just because they can. They determine what to observe, how to link signals, and what the system should do when it identifies something genuine.
Table of Contents
- From Cloud Chaos to Clarity
- What Is Cloud Security Monitoring Really
- Core Components and Key Telemetry Sources
- From Detection Use Cases to Automated Response
- Designing Your Monitoring Architecture for Hybrid Cloud
- Achieving Continuous Compliance and Measuring Success
- Your Implementation Roadmap and Overcoming Challenges
From Cloud Chaos to Clarity
A common situation unfolds across many security teams. One engineer asks if anyone can confirm who modified an IAM policy. Another asks why a workload began communicating with a service it had never contacted before. Compliance needs evidence for access review and log retention. Operations wants to know if an alert is genuine before waking someone up. Everyone is viewing a separate console.
That is not primarily a tooling issue. It is a monitoring program issue.
Cloud environments produce fragmented visibility by nature. Control plane activity resides in one location. Network information is stored elsewhere. Workload telemetry originates from agents, container platforms, or endpoint tools. Identity events are frequently essential to understanding, yet they are isolated from the configuration changes and API calls that provide context. Without structure, teams perform manual forensic work whenever something suspicious occurs.
The business stakes are too high for this to remain a side project. TechMagic's cloud security roundup reports that 82% of data breaches involved cloud data, and public cloud security incidents averaged $5.17 million per breach in 2024That is why cloud security monitoring now belongs within risk management, not only security operations.
Practical rule: If your team cannot describe which cloud events are most important, who examines them, and what occurs after detection, then you do not yet have monitoring. You have storage.
An effective program transforms the experience rapidly. Rather than pursuing separate alerts, the team observes related activity in order. A role change links to unusual API usage. A public exposure connects back to a deployment change. A suspicious login can be examined alongside workload behavior and network movement without switching among six consoles.
That is the move from cloud chaos to clarity. The objective is not perfect visibility. The objective is sufficient connected visibility to make sound decisions quickly.
What Is Cloud Security Monitoring Really
Cloud security monitoring is frequently defined too narrowly, as though it were merely log collection in a hosted environment. That definition overlooks the entire point.
A more useful analogy is a contemporary smart building. The building does not depend on a single camera aimed at the front entrance and call that security. It merges door access records, motion sensors, hallway cameras, badge failures, visitor logs, and a staffed desk that can judge whether a sequence of events is normal or suspicious. A single signal seldom tells the whole story. The value arises from recognizing the pattern.
Cloud security monitoring operates in the same fashion.
Continuous observation beats passive retention
In practice, cloud security monitoring means continuously observing the state and behavior of cloud resources, identities, workloads, and network activity, then linking those signals so teams can detect misuse, drift, and compromise early. The core requirement is active analysis, not archival storage.
That matters because numerous harmful cloud actions appear legitimate on their own. An API call might be permitted. A privilege assignment might be syntactically correct. A workload connection might not trigger a firewall. The problem emerges when those events are connected over time.
Check Point's explanation of cloud monitoring reflects the operating model well: effective cloud security monitoring gathers logs and metrics from cloud services, endpoints, and network controls into a centralized analytics layer able to alert on suspicious access, configuration drift, and anomalous activity in near real time.
The real job is correlation
Numerous teams encounter a familiar obstacle. They centralize data, yet they fail to develop the logic that converts data into detections.
A cloud environment needs layered visibility:
- Identity signals such as login events, role assumptions, service account behavior, and privilege changes
- Configuration state such as public exposure, encryption settings, security group changes, and drift from baseline
- Workload behavior such as process activity, runtime anomalies, container events, and host changes
- Network telemetry such as flow patterns, unexpected peer communication, and internal lateral movement
- Application signals such as auth failures, unusual transactions, and abuse of business logic
A helpful thought experiment is straightforward. If a compromised credential made a risky change, reached sensitive data, and then moved laterally, could your team view that as a single incident instead of four separate alerts?
If the answer is no, the monitoring stack still functions like a filing cabinet.
Monitoring is part of response, not a separate discipline
The most effective cloud monitoring programs regard detection and response as a single continuous workflow. The central platform does more than ingest events. It enriches them, scores them, suppresses clear noise, and initiates either an analyst workflow or an automated action.
That is the gap between observing a dashboard flash and running security operations. Effective monitoring does more than notify you that an event occurred. It enables your team to assess its significance and determine the next step.
Core Components and Key Telemetry Sources
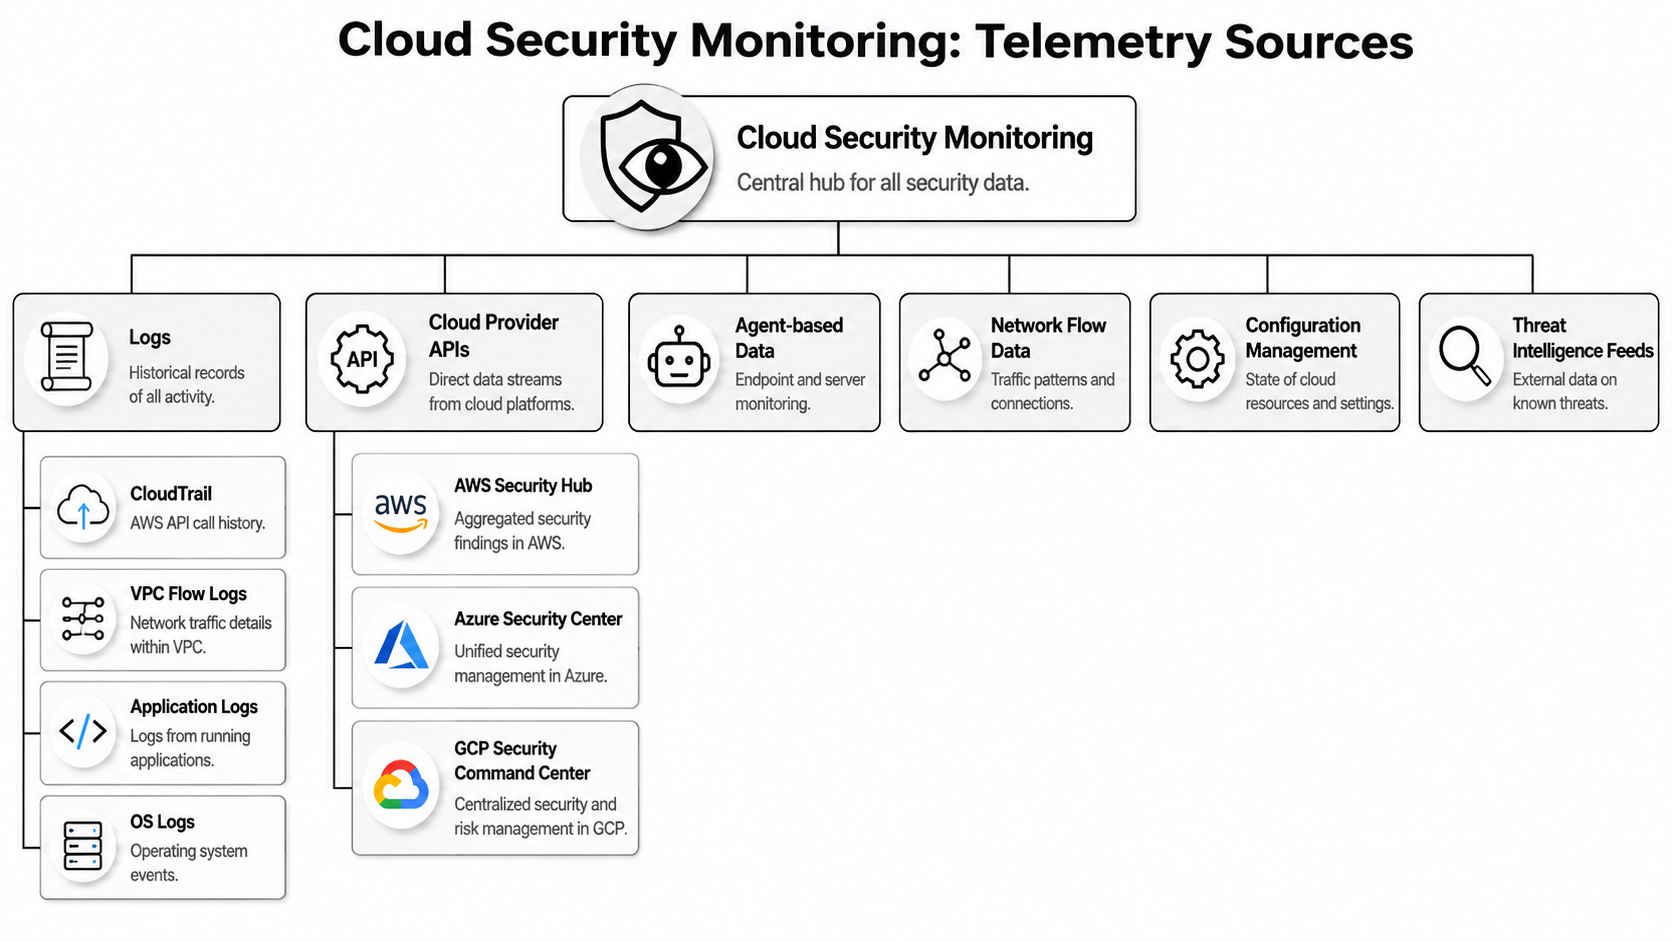
Telemetry selection is the basis of cloud security monitoring. Gather the wrong data and attacks will slip past you. Gather everything without a strategy and you will overwhelm the team with expense and noise.
What to collect first
Teams often start with the telemetry that answers four questions:
- Who did something
- What changed
- What communicated with what
- What happened inside the workload
That leads to a practical first wave:
- Cloud audit logs record API calls and administrative activity. In AWS, CloudTrail is the standard illustration.
- Network flow logs reveal communication routes and traffic relationships, such as VPC Flow Logs.
- Application logs surface business-layer and authentication events that infrastructure logs do not capture.
- OS and endpoint telemetry reveals process execution, file activity, local privilege usage, and behavior at the host level.
- Cloud provider security findings Incorporate posture and detection context from native services.
- Configuration state data uncovers drift, public exposure, and policy violations.
- Threat intelligence feeds assist in enriching external indicators, but they must never be the sole driver of the program.
How the telemetry sources differ
No individual source is sufficient. Each addresses a distinct part of the incident story.
| Telemetry Source | Primary Use Case | Pros | Cons |
|---|---|---|---|
| Cloud audit logs | Track administrative actions and API activity | Strong for identity-linked changes and control plane visibility | Limited detail on runtime behavior |
| Network flow data | See communication paths and movement between systems | Useful for spotting unusual connections and lateral movement | Can lack application context |
| Application logs | Detect misuse inside business workflows | Rich context for auth, errors, and transactions | Inconsistent formatting across apps |
| OS and endpoint telemetry | Investigate host behavior and persistence | Strong for process, file, and execution visibility | Requires agents or endpoint coverage |
| Cloud provider security APIs and findings | Aggregate native cloud detections and posture issues | Useful for fast integration and platform context | Coverage varies by provider and service |
| Configuration management data | Identify drift and exposure | Good for compliance and change monitoring | Doesn't show runtime intent |
| Threat intelligence feeds | Enrich known bad indicators | Helpful for triage and prioritization | Low value without local context |
One frequent error is placing too much value on cloud audit logs because they are simple to turn on. They are required, but they do not account for everything. A control plane event might reveal who modified a security group, yet it will not always clarify what occurred within the instance afterward. Flow data might expose lateral movement, but not whether the process driving it was authorized. Application logs might display a suspicious pattern, but not whether it originated from a compromised identity.
Why the analytics layer matters
Telemetry becomes operationally valuable only after a central analytics layer normalizes and correlates it. That is the role of a SIEM, XDR platform, or a wider detection stack.
This is why teams frequently commit resources to centralized log management early. The goal is not simply to gather logs in one place. It is to create a single decision surface for detections, investigations, and evidence.
Architect's note: Consider telemetry as witness testimony following an incident. A single witness may be mistaken, incomplete, or misleading. Multiple independent witnesses whose accounts align in time are much more dependable.
Mature programs also set behavioral baselines before they push aggressively on anomaly detection. As Scrut's best practices overview notes, anomaly detection becomes more precise when teams first model normal behavior and then identify deviations across users, applications, and systems. That is what makes automated containment more dependable. You are not responding to every deviation. You are responding to a meaningful one.
From Detection Use Cases to Automated Response
Cloud security monitoring delivers practical value when a detection becomes a decision and then an action. That is the gap many teams never bridge. They create alerts, but they do not create response logic.
Check Point's cloud metrics study reports that only 9% of organizations could detect a cloud security threat within one hour, and only 6% could remediate it within one hourThat delay is what attackers exploit. They do not require your systems to be invisible. They only require your response process to be slow.
Start with high consequence detections
A robust program starts with detections that are both frequent and impactful. Do not begin with rare edge cases. Begin with the changes and behaviors that consistently cause harm.
Examples that usually belong in the first wave include:
- Privilege changes such as role policy modification, new admin assignments, or expansion of trust relationships
- Exposure events such as creation of publicly reachable storage, relaxed network controls, or services becoming externally accessible
- Suspicious identity behavior such as unusual login geography, impossible travel patterns, or atypical service account use
- API misuse including bursts of administrative calls, enumeration activity, or actions outside normal deployment windows
- Workload anomalies such as a process spawning unusual child processes, unexpected outbound connections, or changes to startup persistence
- Data access anomalies such as high-risk access from accounts that don't normally touch certain datasets
The design rule is straightforward. Every alert should correspond to a risk statement a responder can grasp. IAM policy changed on production role is useful. Rule 8472 fired is not.
Tie every alert to a response action
SIEM, XDR, and SOAR should function as a single workflow rather than separate products.
For each detection, define the handling path:
| Detection use case | Immediate analyst question | Candidate response |
|---|---|---|
| Admin privilege granted | Was this authorized and anticipated? | Open ticket, notify owner, revoke if unapproved |
| Public exposure created | Should this resource be exposed to the internet? | Remove exposure, tag resource, alert service team |
| Suspicious cloud login | Is the identity in a compromised state? | Disable session, require credential reset, investigate related activity |
| API burst or enumeration | Does this represent automation or reconnaissance? | Rate-limit source, isolate credential, escalate for review |
| Lateral movement between workloads | Does this connection match the normal pattern for this application path? | Segment traffic, isolate workload, capture forensic artifacts |
The main point is that response need not require full automation from the outset. In many settings, the initial phase is analyst-supported automation. The system enriches the alert, collects context, creates a case, and suggests the next step. That alone removes substantial wasted time.
If your team is building playbooks, incident response automation with SOAR is the area to examine closely. The useful question is not whether automation is possible. It is which actions are safe enough, repeatable enough, and frequent enough to justify automation.
Never automate merely because the platform is capable. Automate when the response decision is consistent.
What automation should and should not do
Automation performs well when the action can be reversed, has clear boundaries, and carries little ambiguity.
Suitable candidates include turning off a risky token, isolating a workload, blocking a known malicious IP, adding ownership data to an alert, or opening a case with evidence attached. Unsuitable candidates include wide privilege removal in a fragile legacy environment, changes that may break production dependencies, or containment based on weak detections with high false-positive rates.
A single unified platform provides an answer. Certain teams rely on Splunk alongside separate automation tools. Some use Microsoft Sentinel with Logic Apps. Others choose a consolidated stack. Unified Security Stack, for instance, brings together SIEM, SOAR, and XDR capabilities so detections, evidence, and playbooks operate through one workflow. That approach lowers swivel-chair response, which is important when analysts face time pressure.
The successful pattern is unremarkable in the best way. Detect the event. Gather the context. Rate the risk. Launch the correct playbook. Log the result. Refine the logic after review. Repeating this cycle turns monitoring into an operational capability rather than a dashboard effort.
Designing Your Monitoring Architecture for Hybrid Cloud
Few organizations have a tidy cloud-only environment. They operate on-prem systems, one primary cloud, another cloud introduced by acquisition or product decisions, and SaaS platforms that carry identity and data risk. Architecture must reflect that reality.
A practical design begins with aggregation, yet it cannot end there.
Build for one view across many estates
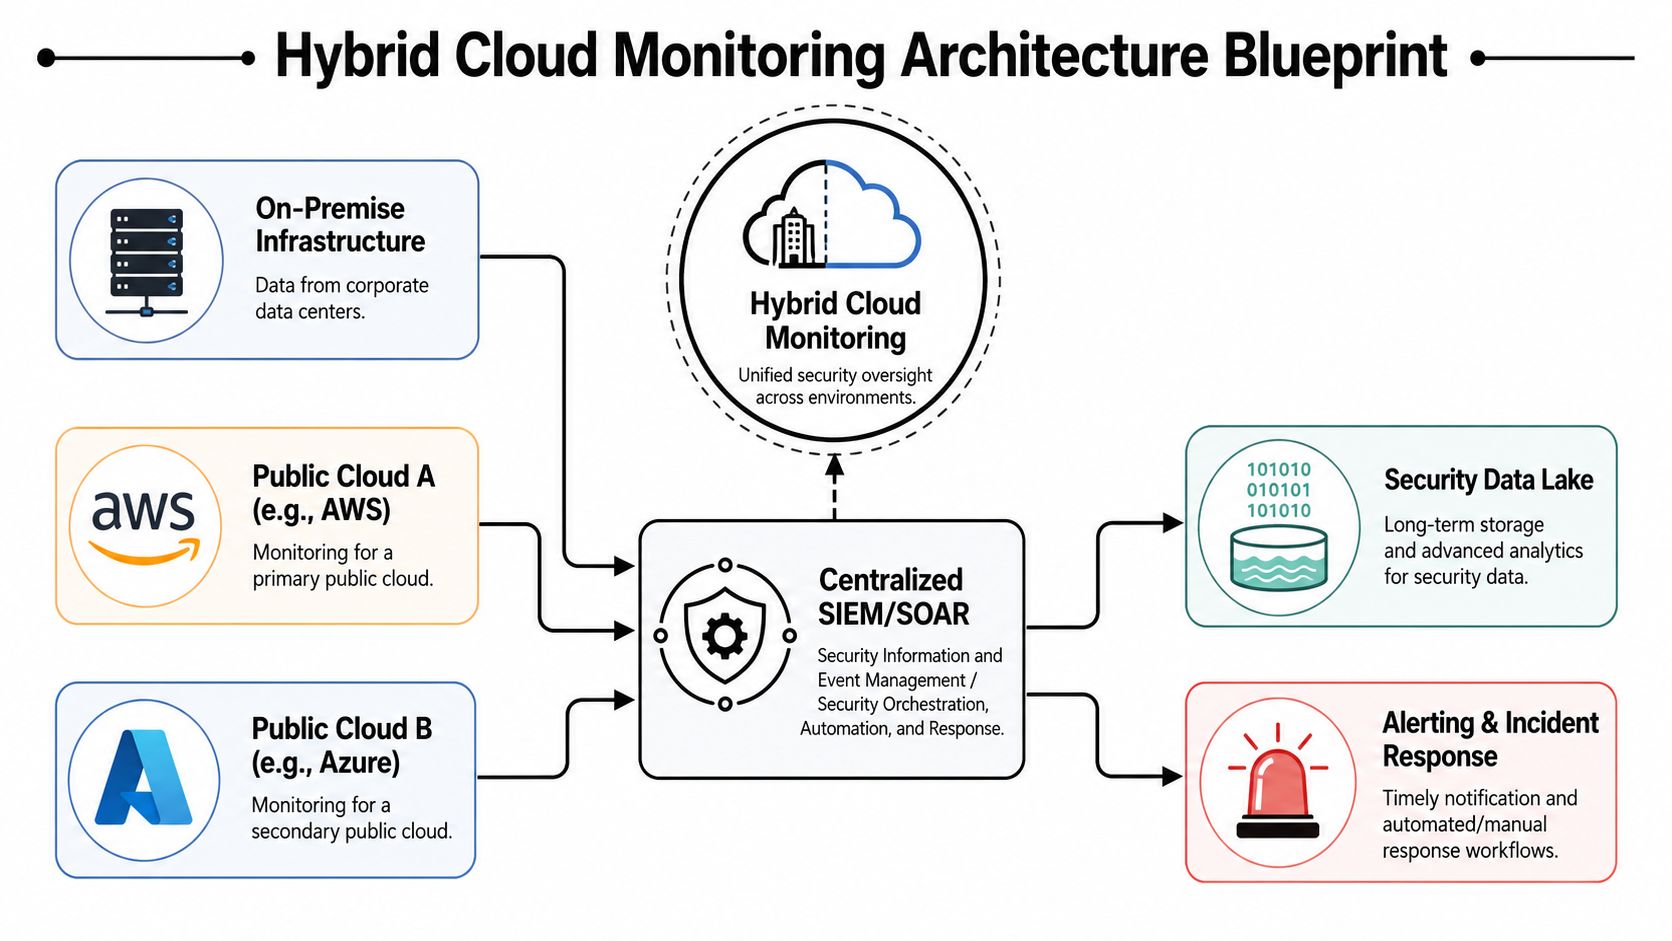
The main design goal is one operational view, not one vendor for every control. Your architecture may combine native cloud telemetry, agents, network sensors, and provider APIs provided they feed a shared analytics and response plane.
That usually means:
- Collectors or connectors near major telemetry sources
- APIs for cloud-native findings and configuration state
- Agents on critical workloads where runtime depth matters
- Network-derived visibility for paths that logs alone won't show
- A central SIEM or SIEM plus SOAR layer for normalization, correlation, and case handling
- A data lake or long-term store for retention, retrospective search, and compliance evidence
For teams evaluating deployment models, SIEM on cloud is frequently the practical focal point since it provides distributed estates a single location for detection logic and response workflows while not demanding that every source system act identically.
A short walkthrough helps when discussing architecture with stakeholders:
Cover east west movement on purpose
Among the largest architectural errors is thinking perimeter visibility is sufficient. It is not.
Gigamon's visibility analysis highlights a major blind spot: many organizations concentrate on north-south perimeter traffic but neglect east-west traffic within cloud environments. This leaves lateral movement and workload-to-workload abuse insufficiently monitored.
A large share of cloud attacks do not look like traditional perimeter intrusions. They begin with identity misuse, API abuse, overly permissive accounts, or the compromise of one workload that then communicates with another internal service. If you monitor only ingress and egress, you may overlook the essential internal sequence.
Internal traffic is often where cloud incidents turn into cloud breaches.
This is why SIEM data from logs should be combined with telemetry derived from the network and behavioral analytics. Logs show what systems reported. Network visibility shows what communicated.
Placement decisions that affect visibility
The placement of sensors and collectors affects what you can observe and how much friction the system creates.
A few rules hold up well in hybrid environments:
- Position identity telemetry near the top of the stack. Identity events frequently supply the earliest useful signal. Aggregate them early.
- Deploy runtime agents to crown-jewel systems first. Do not attempt to instrument all systems equally from the start.
- Apply flow visibility where lateral movement is most critical. Segmented environments, shared services, and sensitive application tiers warrant particular focus.
- Standardize naming conventions and asset ownership. A detection lacking owner context delays response more than most people expect.
- Steer clear of blind handoffs between cloud and on-prem teams. Each incident case should capture both directions of the event path.
If your team needs specialized deployment help, especially for AWS-heavy estates with governance and integration complexity, directories that help you find AWS consulting partners may be valuable when planning architecture or cleaning up a migration.
A sound hybrid design does not attempt to make every environment identical. It makes them visible through a shared detection and response model.
Achieving Continuous Compliance and Measuring Success
A cloud monitoring program gains lasting support when it performs two things well. It lowers operational risk and generates usable evidence.
Security teams occasionally distinguish monitoring from compliance as though one is for defenders and the other for auditors. In reality, the same telemetry frequently serves both. Access logs, change records, vulnerability data, alert histories, and case notes can demonstrate that controls exist, that they function, and that someone examined exceptions.
Turn evidence into audit readiness
Continuous compliance functions better when evidence is produced as a side effect of operations rather than assembled in a rush before an audit.
Examples are straightforward:
- Access control evidence comes from authentication events, privilege changes, and review workflows
- Change management evidence comes from cloud configuration changes and approval records
- Incident handling evidence comes from alert timelines, case artifacts, and remediation actions
- System hygiene evidence comes from vulnerability findings, patch verification, and configuration assessments
- Data protection evidence comes from monitoring for access anomalies, exposure events, and control enforcement
That approach matters for frameworks such as SOC 2, HIPAA, PCI DSS, CMMC, and ISO 27001 because the recurring problem is usually not a lack of controls. It is a lack of defensible proof.
If your organization is preparing for your SOC 2 audit, it helps to specify which monitoring outputs will act as evidence before the audit window opens. That prevents the familiar scramble to reconstruct who changed what and when.
Auditors do not want a narrative. They want evidence linked to control operation.
Measure the program like an operations function
Effective cloud security monitoring should also be evaluated as any serious operational function is evaluated. Not by the quantity of tools deployed, but by whether the program identifies meaningful issues, routes them properly, and prompts timely action.
Useful performance indicators include:
| Metric | What it tells you | Why it matters |
|---|---|---|
| Mean time to detect | How quickly the team identifies real threats | Shorter detection windows reduce attacker freedom |
| Mean time to respond | How quickly containment or remediation begins | Shows operational readiness, not just visibility |
| Alert quality | How many alerts are actionable | Exposes weak rules and wasted analyst effort |
| Coverage by critical asset | Which high-value systems are monitored well | Prevents blind spots around crown-jewel services |
| Evidence completeness | Whether control activity can be proven | Supports audits and internal governance |
| Repeat incident rate | Whether the same issue keeps returning | Shows whether the program is learning |
An extensive metrics catalog is not necessary for every organization. In fact, too many measurements often undermine accountability. A smaller set reviewed regularly by leadership is preferable.
The strongest sign of maturity is that when an incident, audit request, or executive question arises, the team does not begin searching across disconnected tools. The data path, case record, and evidence chain are already in place.
Your Implementation Roadmap and Overcoming Challenges
Most cloud monitoring initiatives fall short for one of two reasons. They either attempt to handle everything in a single phase, or they never progress from collection to response.
A phased approach prevents both errors.
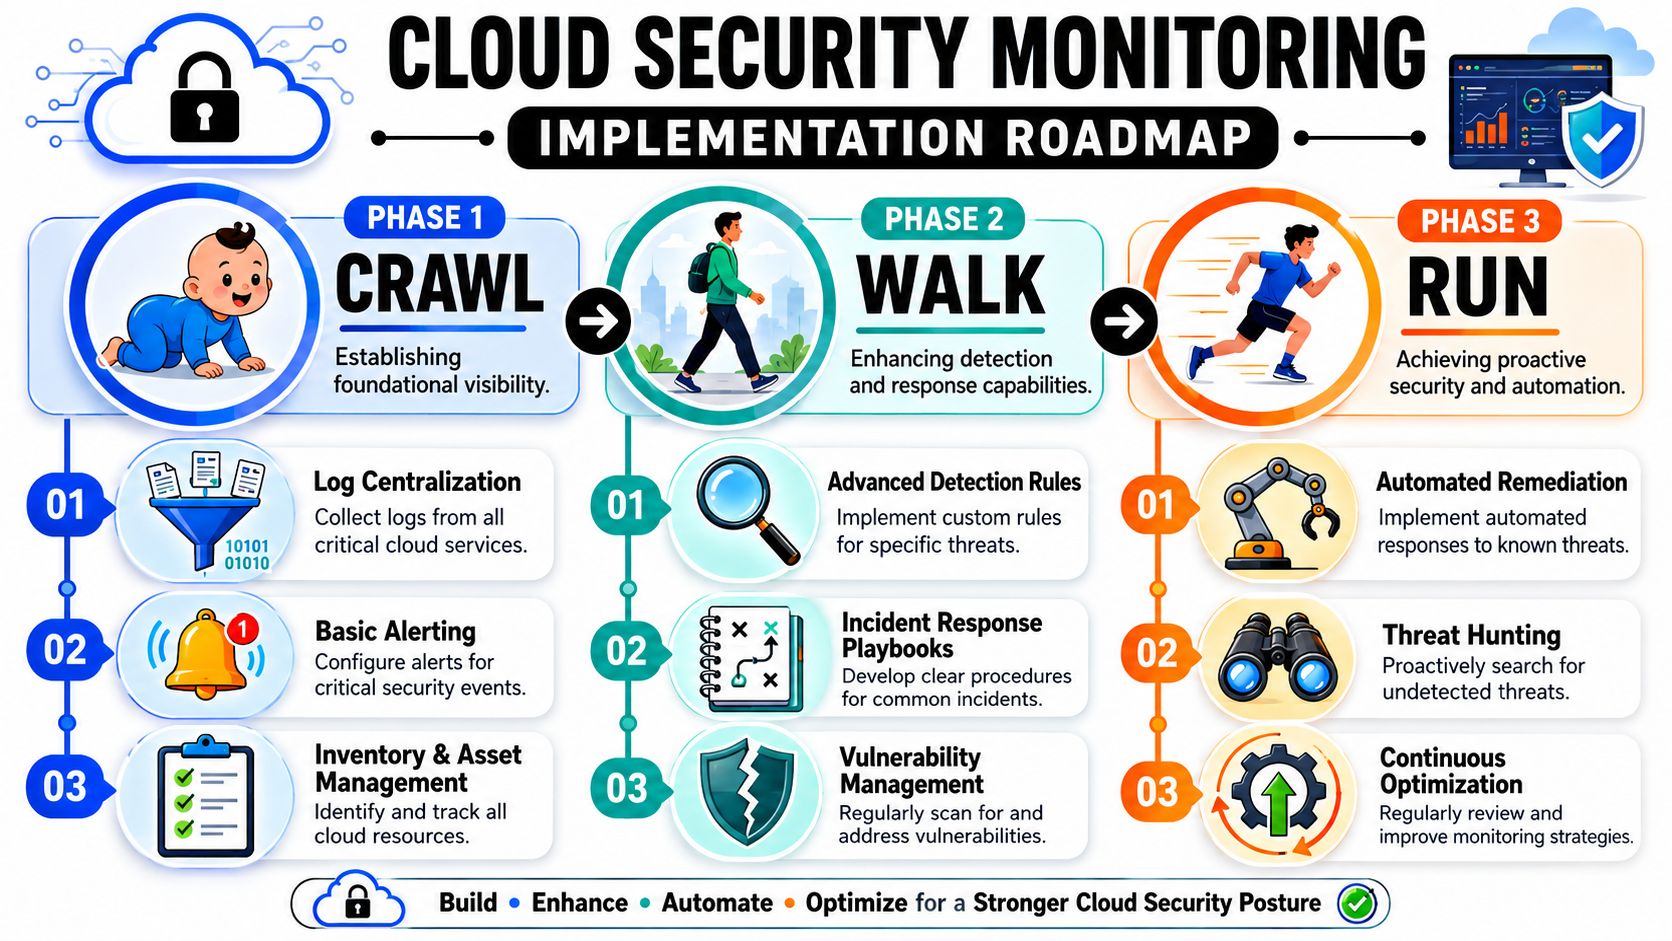
Crawl with basic visibility and ownership
The crawl phase focuses on building reliable foundations.
Begin by centralizing logs from your most critical cloud services and identities. Create a minimum asset inventory. Assign ownership for subscriptions, accounts, workloads, and high-value data stores. Then turn on a small set of high-confidence alerts for privilege change, exposure events, and core authentication anomalies.
This phase is also when teams should decide what they will not ingest yet. That may sound counterintuitive, but selective ingestion prevents the program from collapsing under cost and noise before the team has tuning discipline.
Priorities in this stage:
- Centralize critical telemetry from control plane, identity, and major workloads
- Document ownership so detections route to a real person or team
- Create a triage model with severity, escalation path, and analyst expectations
- Retain evidence consistently for later investigations and audit support
Walk with correlation and repeatable response
The walk phase introduces logic and process maturity.
During this phase, correlation rules offer greater value than isolated alerts. You begin connecting identity events, configuration changes, and runtime activities. Playbooks are developed for recurring incidents. Asset criticality, ownership, and business context are added to alerts. You also evaluate whether detections inform decisions or merely inflate ticket volumes.
Many organizations stall here because alert counts spike. That is not unusual. It signals the team is seeing more, but not necessarily understanding more.
Tuning is the work that matters.
- Suppress known-benign patterns tied to approved automation
- Prioritize by risk instead of treating every event as equal
- Group related alerts into one incident record where possible
- Review misses and false positives after each meaningful event
Cymulate's cloud monitoring guidance makes the key point clearly: a common failure point is not lack of data but excess noise. Organizations that cannot suppress false positives through tuning and risk-based prioritization struggle to operationalize monitoring because analysts become overwhelmed.
The adversary of cloud security monitoring is not only the attacker. It is the stack of low-value alerts that teach your team to disregard the console.
Run with automation and continuous tuning
During the run phase, the program begins to function as a genuine security operations capability.
By now, your team trusts its core detections enough to automate certain responses. High-confidence actions can disable tokens, contain endpoints, stop known malicious sources, label or isolate at-risk assets, and create structured incidents with attached evidence. Threat hunting turns practical as telemetry is normalized and the baseline is more defined. Compliance evidence is produced continuously instead of being compiled by hand.
AI-assisted triage can also add value here, provided it is applied with care. It should assist analysts by condensing alerts, surfacing probable connections, and recommending rule enhancements. It must not serve as a reason to bypass detection engineering.
Three challenges usually persist even in mature environments:
Tool sprawl
Teams add one product for posture, a second for detection, a third for response, and a fourth for reporting. Integration effort turns into an ongoing tax.Skills bottlenecks
Cloud detection engineering, incident response, and compliance mapping frequently reside in separate teams. Common workflows count for more than organizational structure.Environmental change
Cloud environments do not remain static. New services, pipelines, and identity paths continually alter the detection surface.
Disciplined iteration is the path through those challenges. Examine noisy rules. Retire outdated detections. Extend coverage where incidents revealed blind spots. Revisit ownership as teams reorganize. Strong monitoring programs are never complete. They are sustained.
If you're building or rebuilding this capability, Unified Security Stack One platform to evaluate for unifying SIEM, SOAR, XDR, log management, and compliance workflows across hybrid environments. The operational benefit of a unified stack is practical: a single location to ingest telemetry, correlate events, automate response, and retain evidence without stitching together separate systems for every step.